
The Hertzsprung-Russell diagram
In astronomy, we would all agree that stars are our raw material. They are the foundation of everything!
Nebulae are formed by the end of stars' lives, and they are also their genesis.
Together, they form star clusters called galaxies; they are countless, of all shapes, sizes, and colors.
To better understand them, we need to know how to classify them by family and criteria.
The Hertzsprung-Russell diagram, or H-R diagram for short, is a graph that shows the luminosity of a set of stars as a function of their temperature. Furthermore, this diagram is useful for demonstrating the evolution of stars at different stages of their lives. It was invented around 1910 by Ejnar Hertzsprung and Henry Norris Russell.
This diagram is a key tool for understanding our stars.
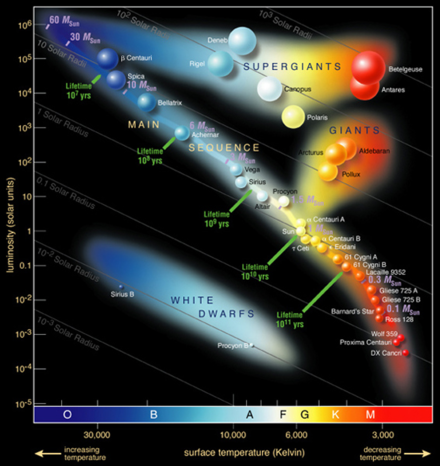
- On the horizontal axis, you'll notice the scale showing the temperature and color index (B-V). The spectral type is also represented, with the basic star types: O, B, A, F, G, K, and M. The brightest, and therefore hottest, stars are on the left, moving towards the coolest on the right.
- On the vertical axis, you'll find the smallest and least luminous stars at the bottom. As you move up this axis, the temperature increases, as does the volume of the stars. Since they are larger, they are also more luminous.
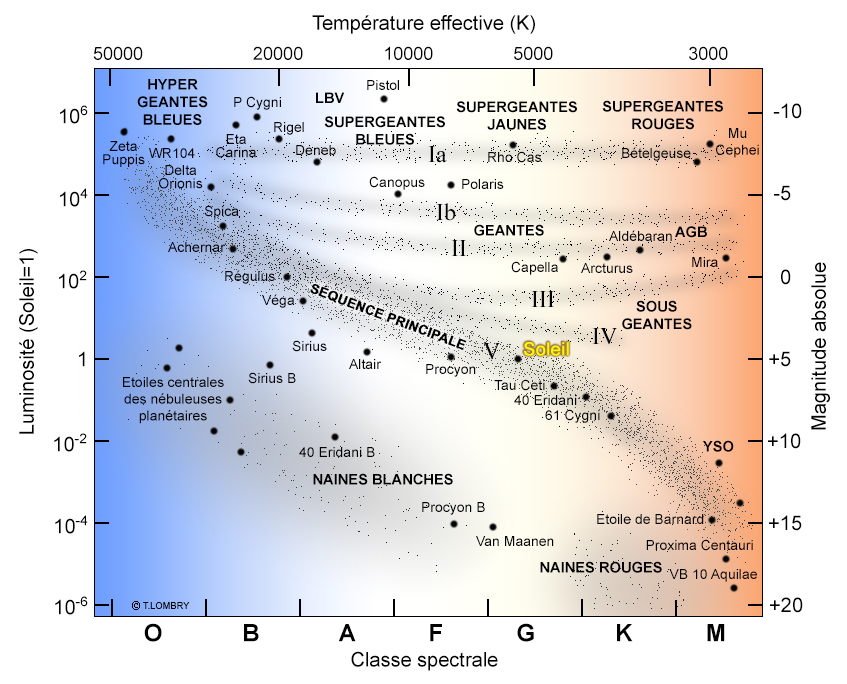
- In this table, on the right-hand scale, magnitudes are given in absolute terms (magnitude of the star at a distance of 10 parsecs from Earth).
- On the left-hand scale, luminosity is ranked by solar mass.
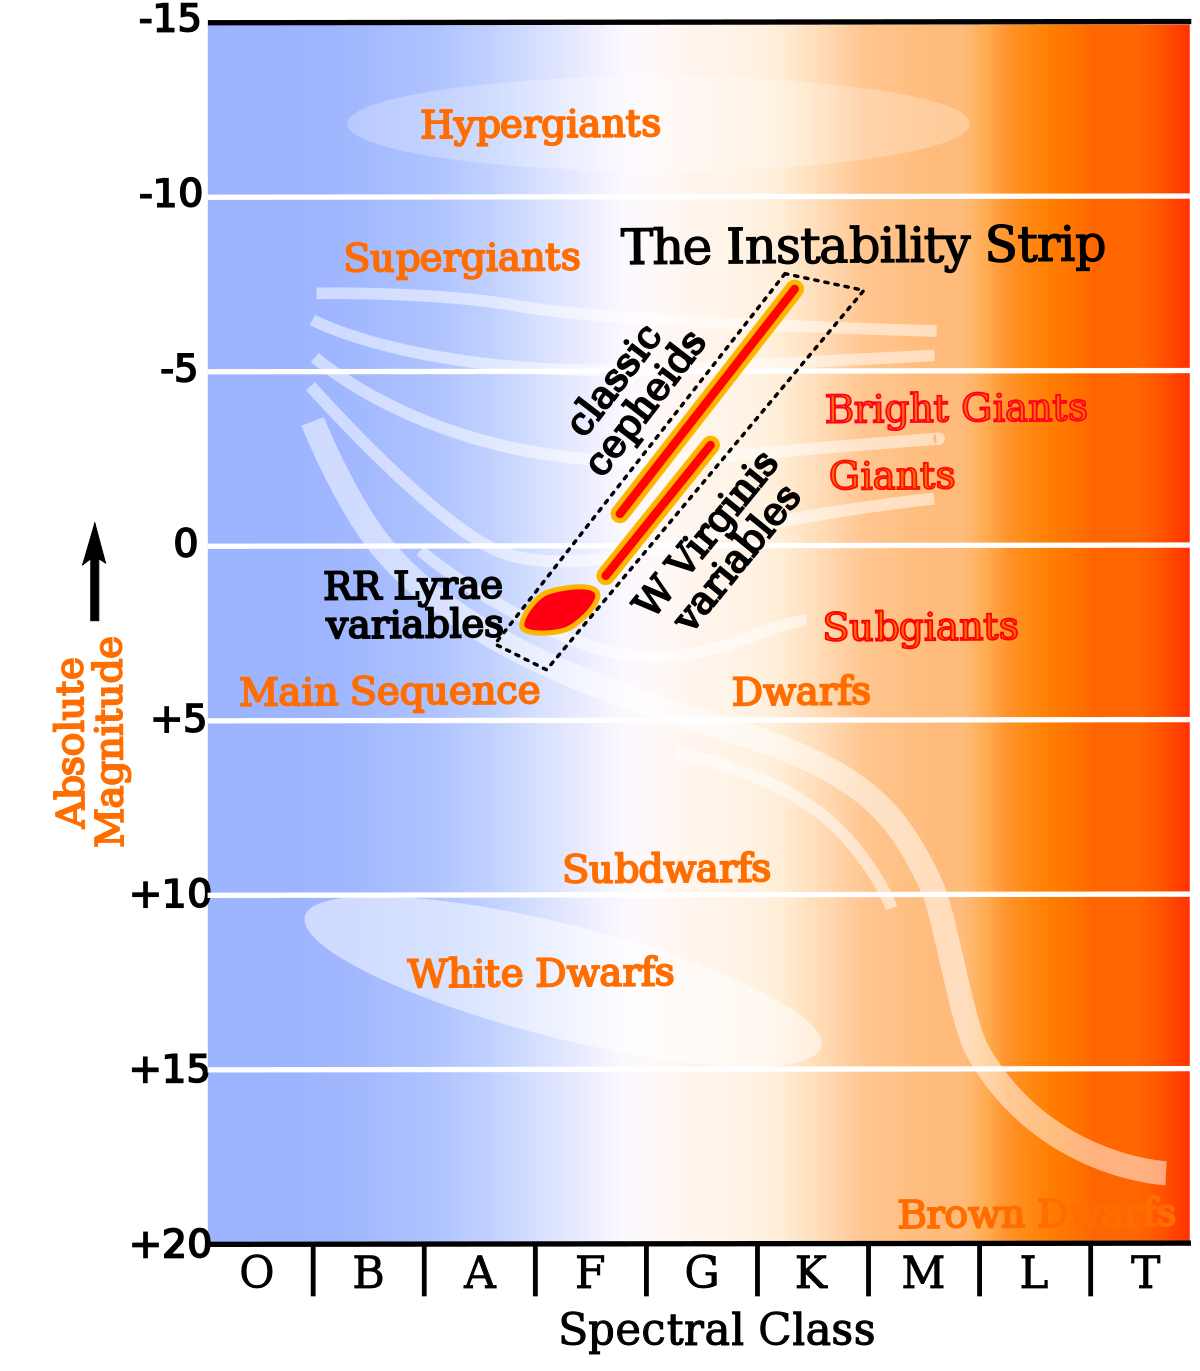
By overlaying our known stars onto the graph, bands of stellar concentration appeared, thus forming the classification and sensitive regions where these stars will be more abundant according to their intrinsic characteristics. White dwarfs, subgiants, giants, supergiants...
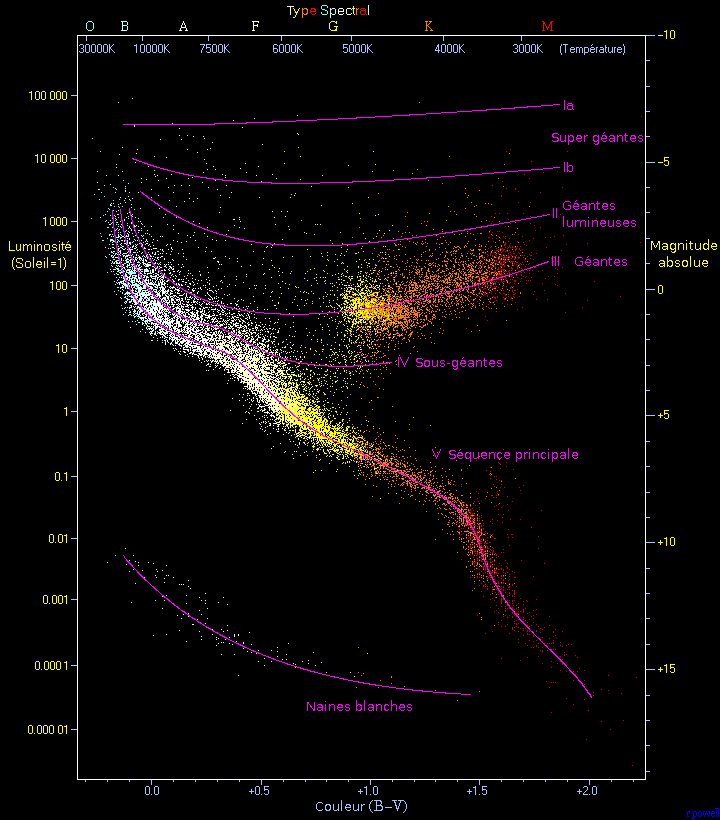
Then there are the important bands like the main sequence, the instability band where Cepheids, W Virginis, and other pulsating stars are found.
Note the appearance of new spectral types like L and T.
Although it still lacks the Y, R, N, S, and C classes, the H-R diagram primarily informs us about the status and evolution of stars.
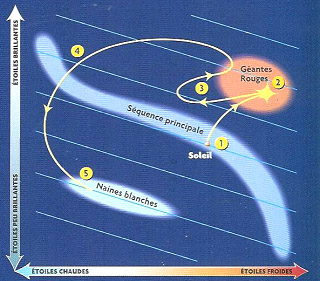
If we examine the past, present, and future trajectory of our Sun, for now, it is burning its hydrogen into helium, much to our delight. It will do the same for 9/10 of its life on the main sequence.[1]
But later, when the hydrogen runs out, leaving the main sequence, it will enter a band of instability, expand, and become a red giant. During its ascent to this stage, it will undergo a rapid hook (helium flash).[2]
Subsequently, it will contract before expanding one last time.[3]
And it will begin its final transformation into a white dwarf. With a radius roughly equal to that of the Earth, it will slowly cool.[4-5]
The durations of these different phases are as follows:
Main sequence: 10 billion years
Helium flash: a few days
Red giant: 2 billion years
Planetary nebula: 30,000 years
*http://www.astrosurf.com/quasar95/exposes/Diagramme_HR.pdf
This means that if we know a few characteristics of a star, enough to place it on this diagram, we can determine its stage of evolution and almost all other related information.
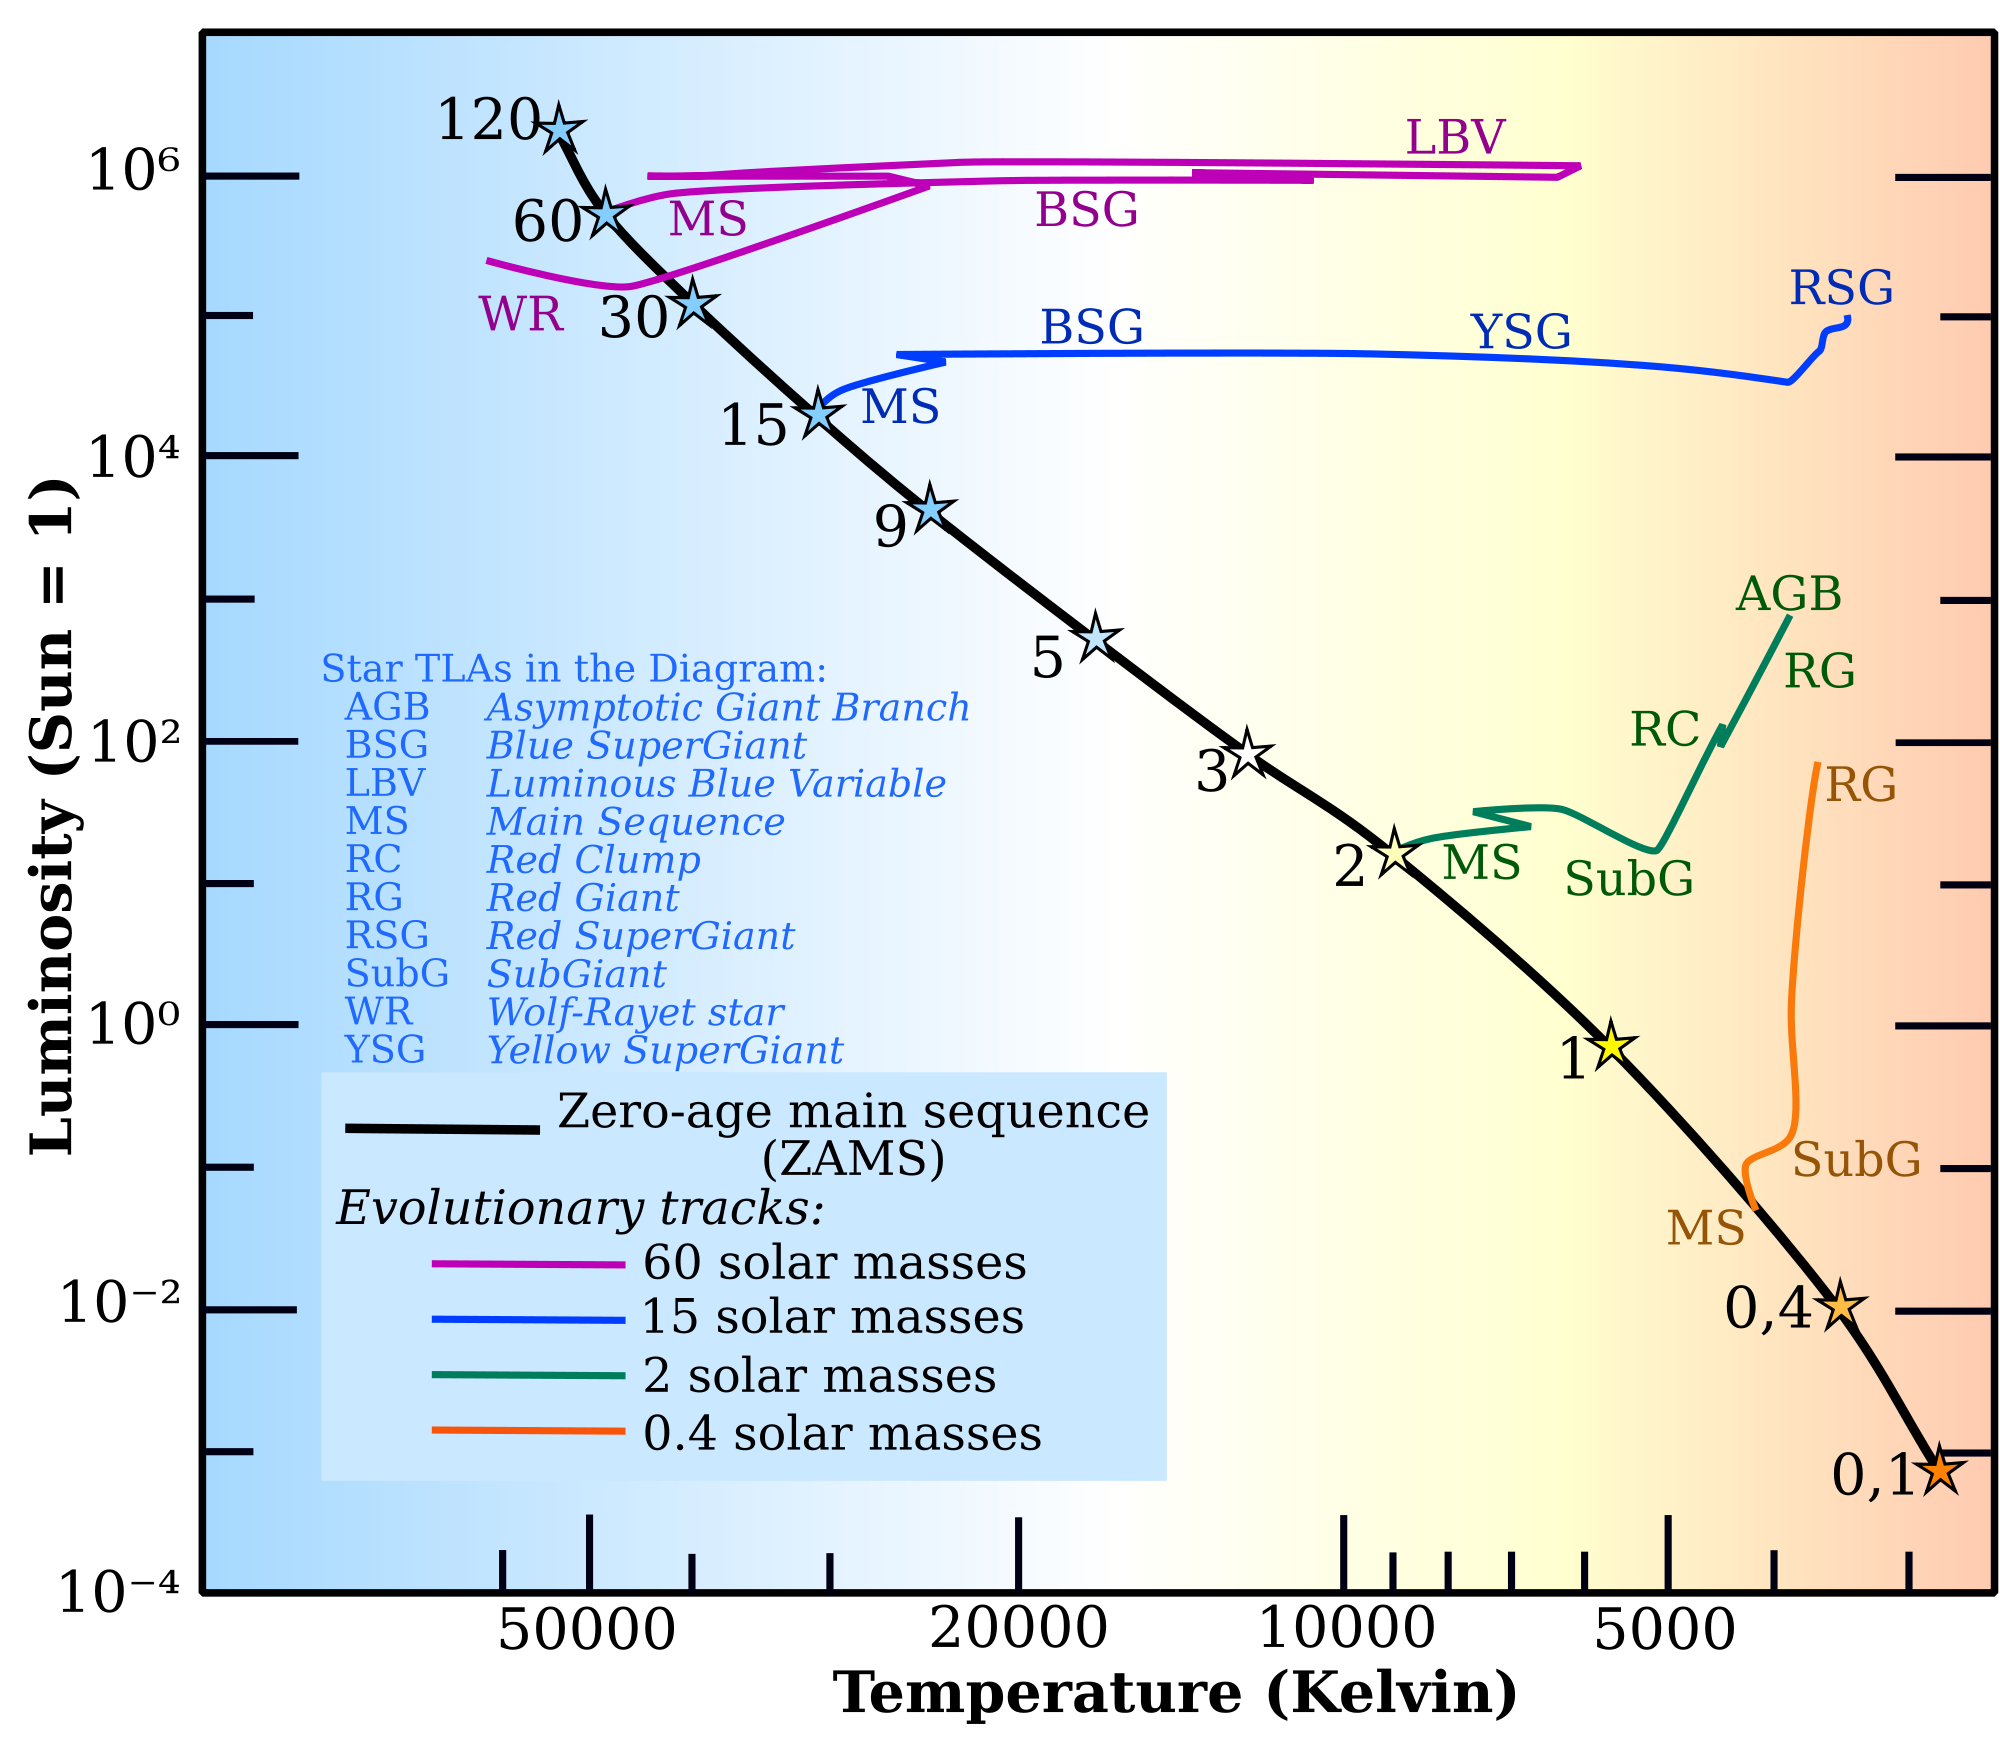
The Hertzsprung-Russell (H-R) diagram can also be used for stars with masses different from the Sun.
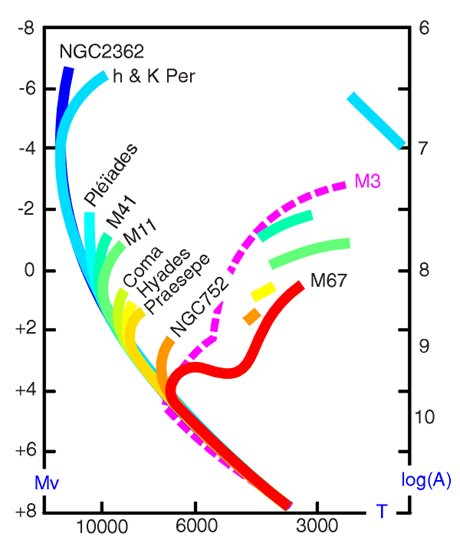
The same approach is used in the analysis of clusters and other celestial objects that are more specific and less general than galaxies; again, it is by observing the stars contained in these objects and placing them in the diagram that we obtain a complete profile of the stars composing the object.
*By studying the Hertzsprung-Russell (H-R) diagram, we can also conclude that after 1.5 billion years, all stars with a mass greater than 2.2 solar masses have disappeared from the main sequence. The main sequence will therefore be missing its left-hand side, corresponding to the high-mass, short-lived stars. These massive stars are on the giant branch and are moving upwards and to the right of the diagram. (*http://www.astrosurf.com/quasar95/exposes/Diagramme_HR.pdf)
Suggested readings and references:
http://cepheides.skyrock.com/1148676932-DE-L-ASTRONOMIE-mort-d-une-etoile.html
http://www.astrosurf.com/adaes/expo-energie-et-lumiere-5.html
http://www.soaslyon.org/index.php/supports-de-cours-et-formations/57-cours-sur-les-etoiles/205-le-diagramme-h-r
https://media4.obspm.fr/public/ressources_lu/pages_evolutionstellaire/evolution-stellaire-hr_impression.htmlhttp://www.astrosurf.com/luxorion/vie-etoiles5.htmhttps://fr.wikipedia.org/wiki/Type_spectral#Classe_R,_N,_S_et_Chttps://www.optroastro.com/etoiles.phphttps://fr.wikipedia.org/wiki/Chronologie_du_futur_lointain
JBD - Février 2018