
Article en Français
Variable Star Tracking Program
From my earliest days in astronomy, astrophotography initially captivated me...
Then scientific astronomy took over!
Making what you do useful, having a reason, a purpose, and above all, "learning"!
Damien Lemay had often told me about the follow-ups he did for the CBA. At first, I found him a bit "extreme," to be honest.
Then I let myself be drawn in by his courses on CCDs, on variables, their types, frequencies, and curves, not to mention the analysis of these curves using various methods and software. Since then, I've really caught the bug... Damien was right, and he has become one of my mentors!
In this presentation, we will simply provide a brief overview.
Photometry could be the subject of a book of over 1000 pages, covering the entire theory of fluxes and calculations. Similarly, we will limit ourselves to discussing only differential photometry and apparent, rather than absolute, magnitude.
Ultimately, photometry always comes down to the same method: evaluating the flux of a variable star by comparing it to nearby stars known to be non-variable. Depending on the type of star, observations can be made with filters for greater precision, but the basic method is simple.
So simple, in fact, that many amateur astronomers practice this type of observation with an eyepiece, turning these observations into a challenge to judge a star's brightness by comparison to others around it.
If the reader wishes to delve deeper, I am always available to answer questions to the best of my ability, or workshops on the subject may be offered. Not forgetting that there is still the AAVSO, whose family is still growing and attracting new followers.
Let's start with the equipment:
At the OMSJ observatory, I use two telescopes mounted on an Ioptron mount: a C14 and a 952mm ED-127 refractor.
The latter is dedicated to photometry for several reasons, but particularly for the wide field of view and precision that this apochromatic refractor offers.
This telescope also has an electric focuser, an 8-position filter wheel for photometry filters (V, B, Rc, Ic), and of course, a clear filter.
These filters are Johnson/Cushion type and are the "standard" for photometry. The goal is to be able to evaluate the photon flux arriving from a star with precise calibration.
The ones I use are Optolong brand. I like them because their curves are "tighter" than standard Johnson/Cushion filters. One of the advantages of this "standard" system is that it has been studied and widely used in numerous research projects, resulting in the availability of several statistical methods, such as the B-V calculation for determining a star's surface temperature. Others, like V-R and V-I, provide statistical indices of the opacity of the environment surrounding certain stars, such as symbiotic stars.

Of course, there are other filters and photometric systems such as Sloan filters. More expensive and more selective, they are the go-to choice for professionals in very specific research.
I don't own any, as I've never had a project request involving them. Furthermore, Johnson/Coussin type filters are still the standard in classical astronomy, much better suited for most tasks, not to mention their compatibility and long-term data standardization.

The camera is a high-end SBig ST8-XME, which lacks anti-blooming technology but offers high sensitivity thanks to its 9-micron pixels and large sensor size.
These factors are important and make a difference when tracking asteroids or Kilonovas and for long exposures.
Here, the system delivers a resolution of 49.7 x 33.2 arcminutes and 1.95 arcseconds per pixel.
*So, for differential photometry, you don't need a powerful telescope; even a DSLR camera on a 200mm lens can do the job.
The important thing is to be able to capture our variable star with other reference stars in the same image.
Planification
To begin, the AAVSO offers a free star chart service at https://www.aavso.org/apps/vsp/.
VSP stands for "Variable Star Plotter."
On this website, simply enter the name of the star you wish to explore, select the chart scale (from 7.5 to 900 arcminutes), the type of observation, and click "Plot chart." Several other options are also available.
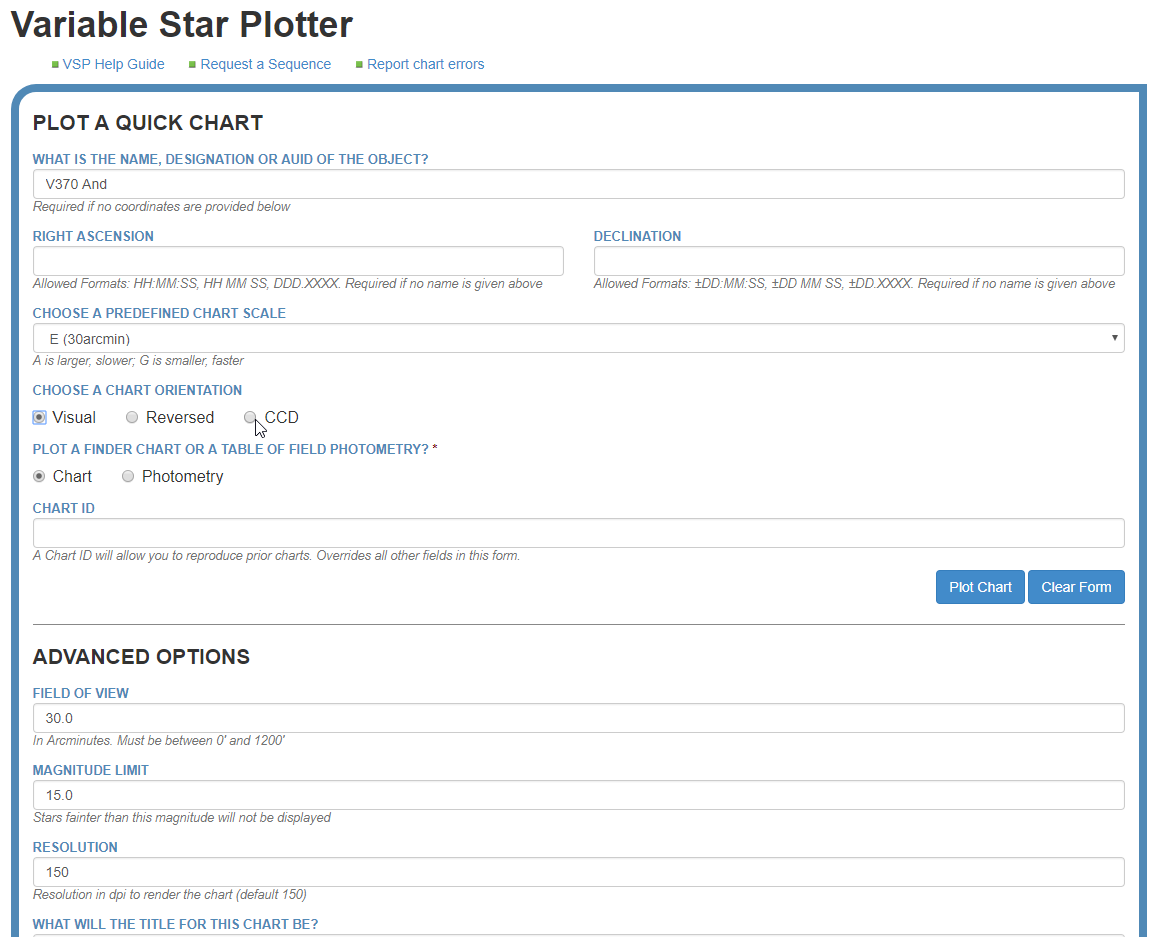
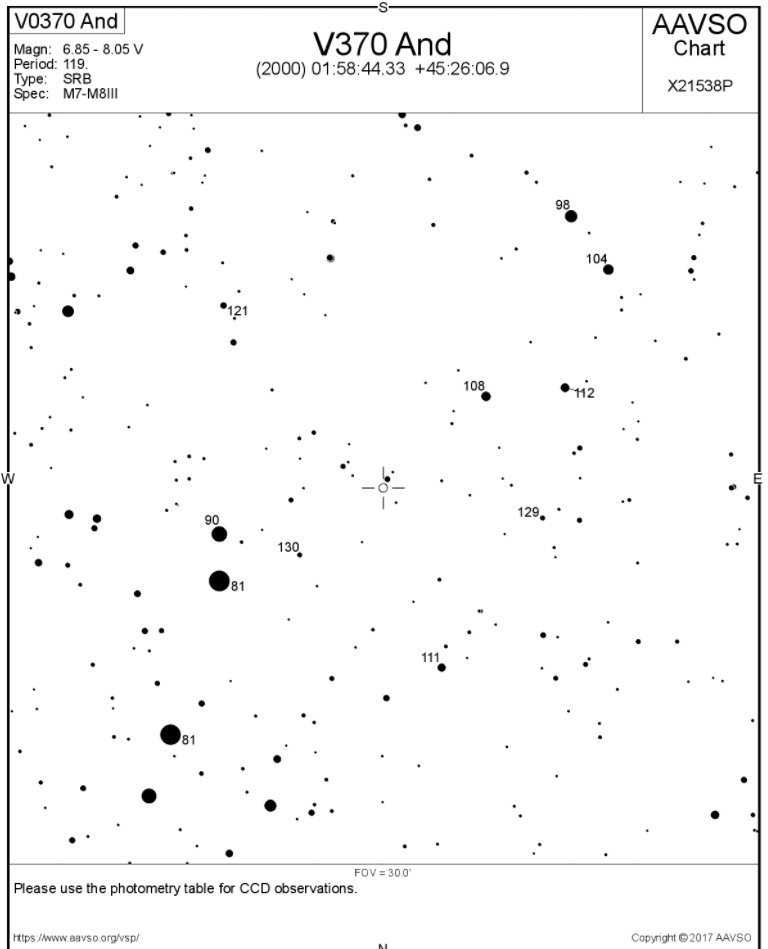
To accompany this map and make it usable, we need a table of reference stars to validate the magnitude of the star being observed.
To obtain it, select the "CCD" option from the selections:

At the bottom, we also have options for:
- the map orientation,
- using a DSS image as a background,
- whether to display other variables on the map,
- and the magnitude of additional filters.

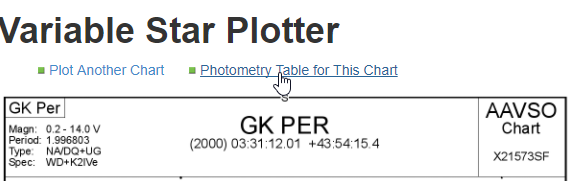
Or you can click on "Photometry Table for this Chart" when the chart appears.
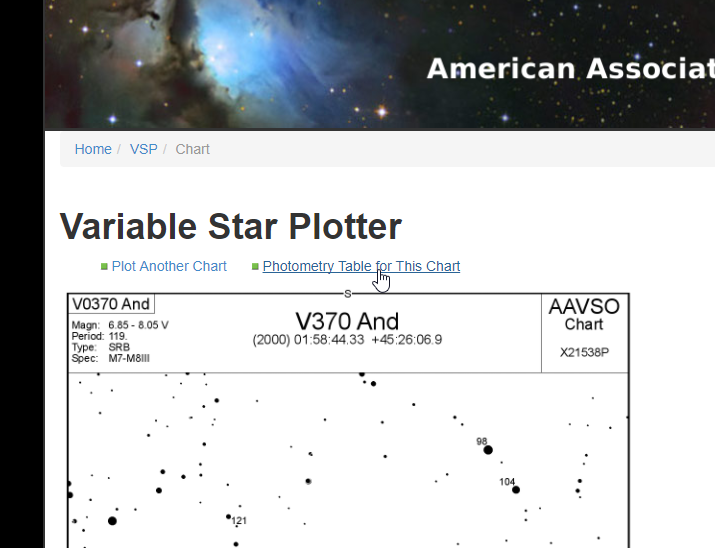
This results in a table of all the reference stars that are configured for the map:

Note that the reference magnitudes are those in the V column, rounded to three decimal places.
The color index (B-V) provides information about the temperature of the reference star.
Therefore, it is important to choose our reference stars with a B-V that most closely matches our target star.
We're ready for our star!
Shots taken
- Exposure time is very important.
When taking images, pay attention to the SNR (Signal-to-Noise Ratio). A minimum of 100 is recommended, and be careful not to overexpose the target star.
- Generally, taking 5 to 10 images per star will suffice.
* Unless the monitoring requires a series covering an event such as a transit of a cataclysmic event in full reaction, in which case hundreds of images will be taken continuously to create a curve for analysis.
- Image framing
Since we have taken the time to prepare our observation and create star charts on the AAVSO website, ensure that the comparison stars are within the frame of the image and that the variable star is centered.
- Flat images will be taken at the end of each session.
The filtres
We've already discussed filters, and it's worth noting that they aren't always necessary depending on the type of star you want to observe.
Of all the filters, the 'V' filter is the most commonly used. Next comes the 'R' or 'Rc' filter, then the 'B' filter, and finally the 'I' or 'Ic' filter.
But as you might expect, images taken with B and V filters will provide the B-V filter, which is so important for determining the temperature of our stars.
*Note that for monitoring cataclysmic events and a few other types, no filter is necessary.
Treatments
The processing involves basic calibration using dark and bias frames, which are taken in advance, at a controlled temperature, and before each new season. Flat images, on the other hand, are taken at the end of each session using a specially calibrated LED panel. Flats, or PLUs (Point Lumen Illumination), are also part of the process.
Several software programs can perform differential photometric processing, but only a few can generate a report compatible with AAVSO standards. Among these, MaximDL and AIP4Win are leading the way. AstroImageJ will follow soon. At least, many hope so, as this software is free and very powerful when used for exoplanet transits and other photometric tracking.
However, it still lacks a photometric report in the AAVSO format.
For this overview, we will use MaximDL V5.23, whose module remains highly regarded and functional.
For this example, we will use images of GK PER, a star whose variability is of the NA/DQ+UG type, therefore an irregular nova. An article will be published online soon about this star, which has a very special binary system.
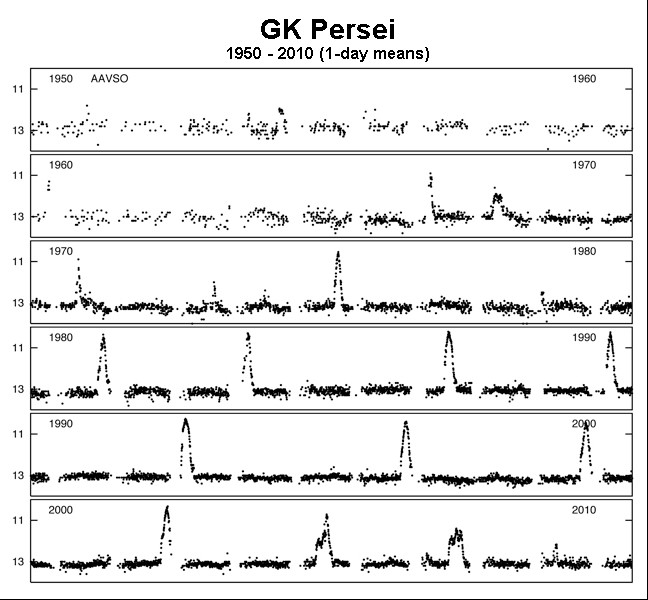
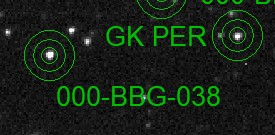
For photometry, we need a reference map with the same orientation as our image.
In my case, it will be this map:
*Note the card number: « X21573SF »
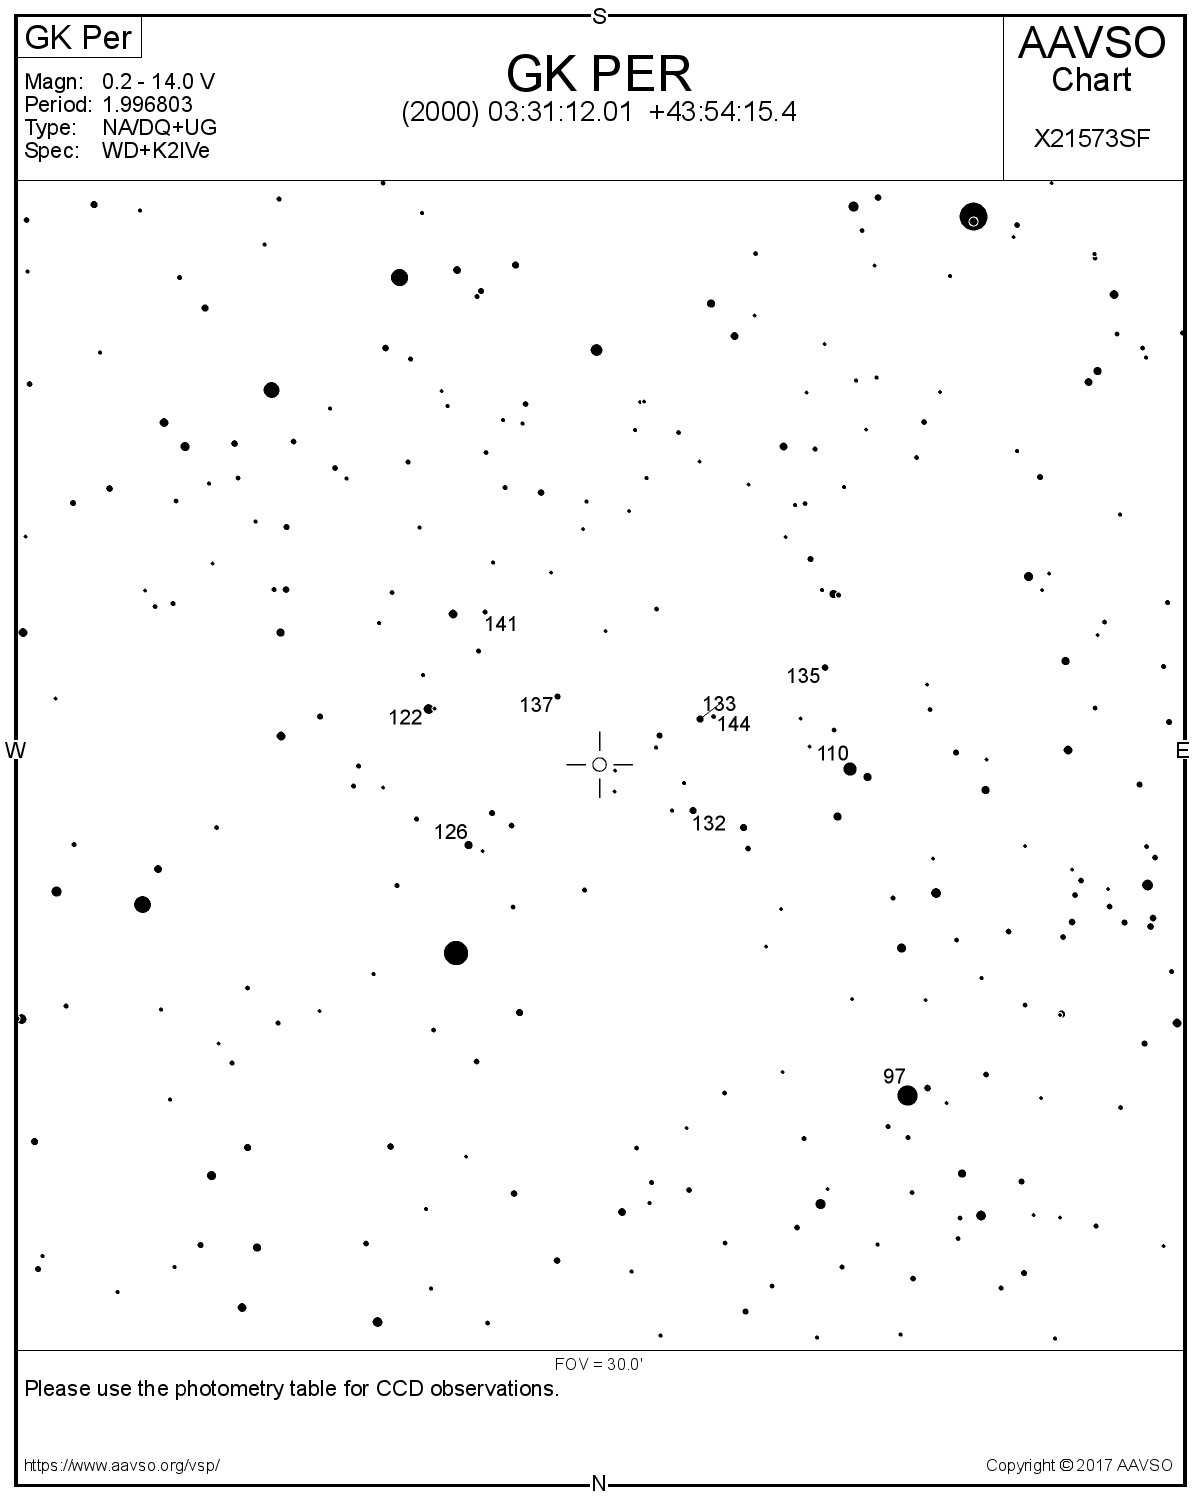
Next, you need to retrieve the reference star rating table by clicking on the link:
On the map, you will notice three-digit numbers; these are the magnitudes of the reference stars, but without the decimal point. These same numbers are found in the table; the correct magnitudes to enter are those in column 'V', rounded to three decimal places.
Processus with MaximDL (5.25)
1- Basic calibration
The steps :
- Insert the flat images using the "Menu-> Process -> Set Calibration" process..
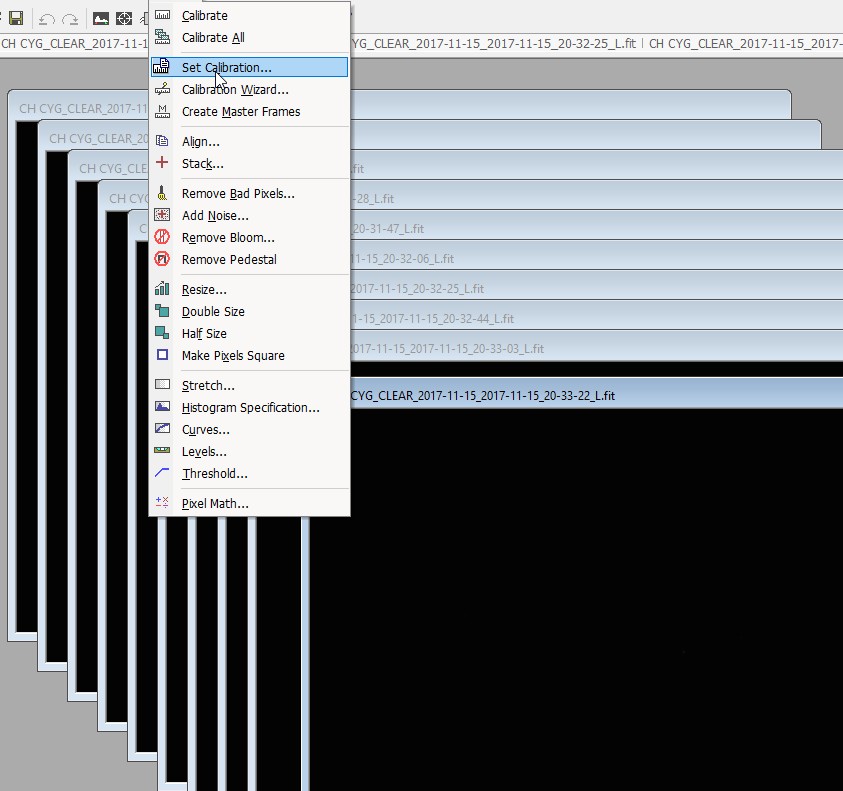
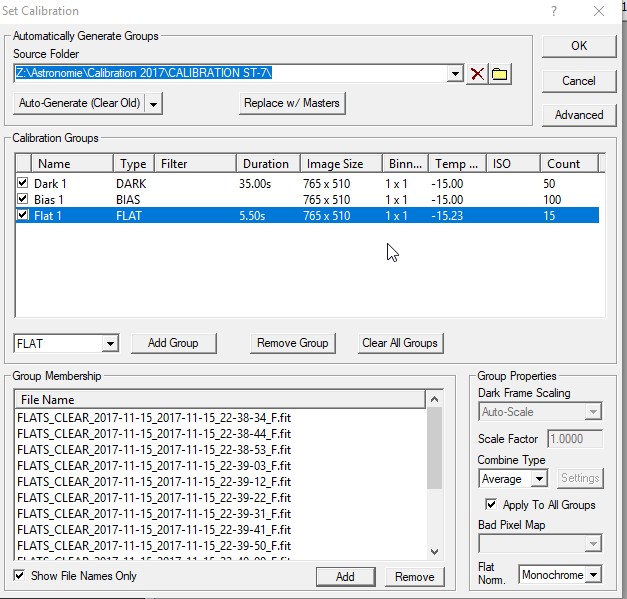
* Open the images in the program. -
Click on the path "Menu-> Process -> Calibration All".
Then, visually verify that all images are compliant and of good quality.
That covers the basic calibrations.
2- Photometry of our star
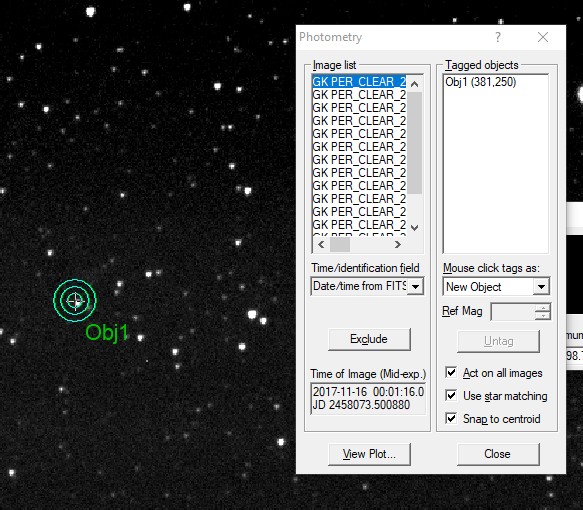
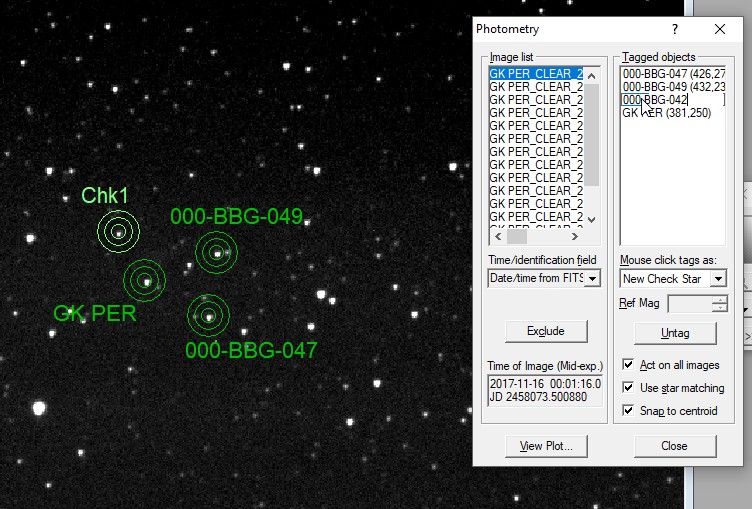
So, based on this information, we open the "Photometry" module of MaximDL.
A new image appears with the module.
*Adjusting the aperture radius, which is used to aim at a star, is very important...
Remember that:
- The inner radius covers most of the light from the target star.
- The outer radius provides a measurement of the background sky.
- The central radius separates the two.
Select "New Object" and, in the image, click on your star, referring to the map obtained from the AAVSO.
Then, by double-clicking, rename the object to GK PER.
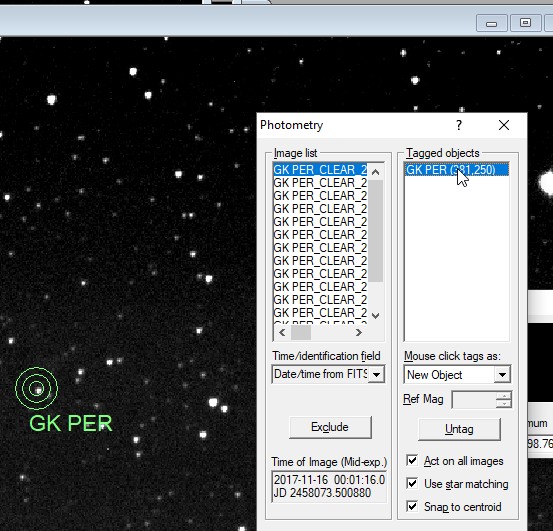
The software will quickly locate this star in all the images.
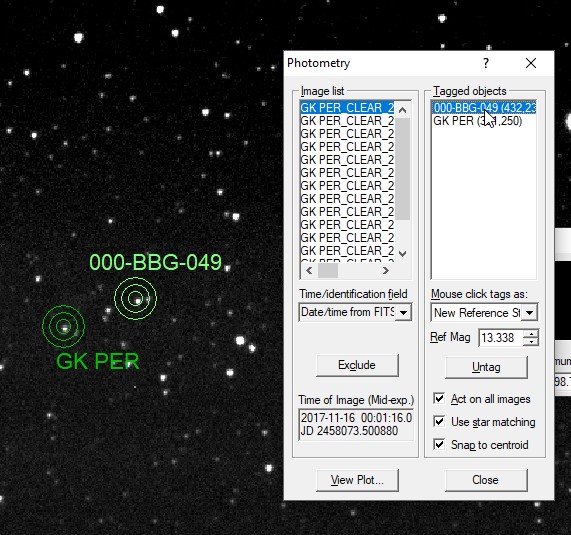
2- Reference stars
For reference, I generally use two reference stars for greater accuracy.
So, select "New Reference star" and click on the first star you choose, always referring to the AAVSO chart.
For my first star, I chose the one identified by the number 132. According to the chart, this is the star "000-BBG-04," which has a stable magnitude of 13.189.
Then, fill in the information again by double-clicking in MaximDL.
N.B. : MaximDL (5.25)uses only decimal points here, not commas.
We repeat the process for a second star.
We're almost done!
3- Validation star (Check star)
We now need our "Check Star" to validate the uniformity of our images.
To do this, we choose "New Check Star" from the list and select our star.
Here, the star's magnitude isn't necessary, but it must be in the list.
So we select it and enter its name in the list by double-clicking in MaximDL, and as always, we rename it with the name or number of the star used.
4- Data recording
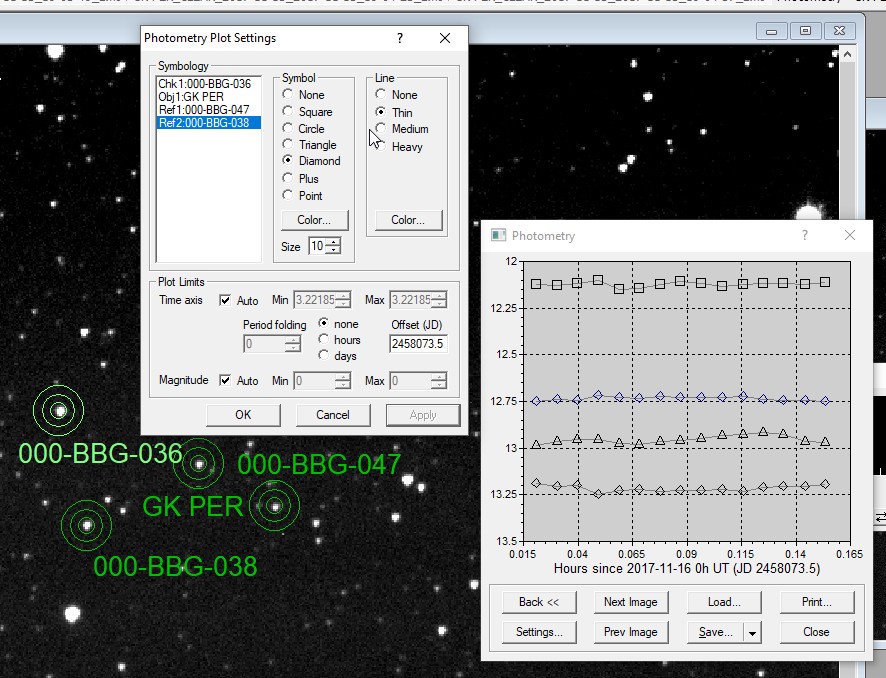
Our photometry is complete. We now need to save it in a format compatible with AAVSO standards. You can view the graph by clicking on "View Plot".
The graph's appearance can be modified via the "Settings":
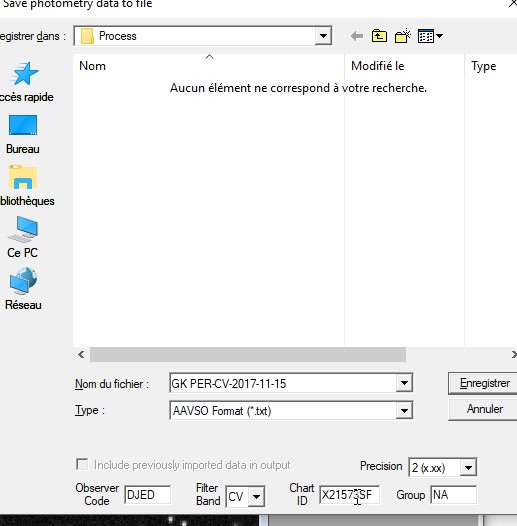
I also chose to save each report in CSV format for my own statistical purposes.
I will then process this data in an Excel file to track my observations.
The TXT file is in the AAVSO format and must include the card reference number. This is the file that can then be sent to the AAVSO as an observation report, along with the observer code and the filter used. If the filter is clear, the 'CV' information will be selected.
VOILA! ... It's simple, isn't it? ;0)
JBD 2017 (Révision 2022)